// data platforms · 2 November 2026 · 9 min read
Building an end-to-end data platform on Snowflake, from raw files to a certified dashboard
Every layer, every check and every dashboard, with all the code open source
 Muhammad MairajSenior Backend Engineer
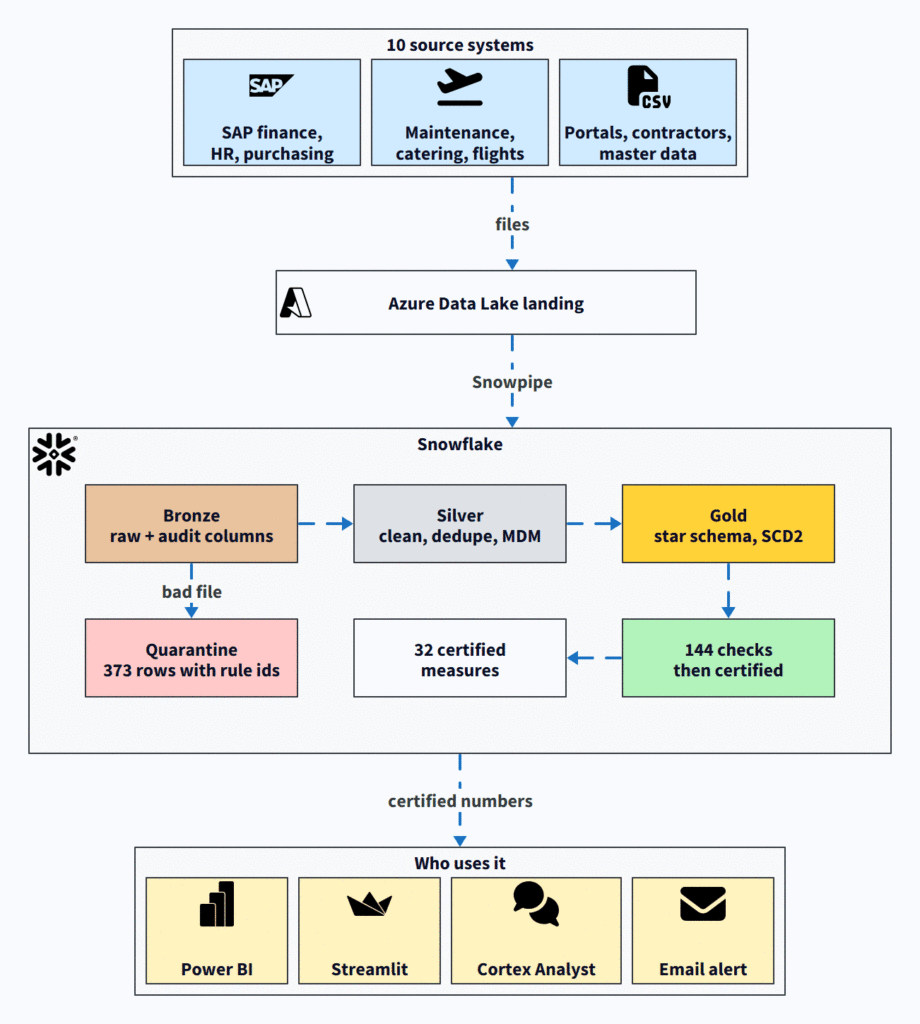
I built a complete ELT pipeline on Snowflake, from raw source files all the way to dashboards a finance director could sign off on, and published every piece of it: airport-services-edw-demo on GitHub.
The company is fictional. Airport Services Co. (ASC) is a ground-handling and flight-catering group at a made-up airport, with four legal entities and a home airline called Gulfway Airways. All of the data is synthetic: a Python generator writes the source extracts from a fixed seed, so every run produces exactly the same numbers and anyone can reproduce them.
What it covers, end to end:
- Data ingestion: source files landed in a stage or an Azure Data Lake container, loaded by Snowpipe.
- Data quality: a malformed file is validated, rejected and quarantined row by row.
- Integration: codes, entities and vendors from different systems merged into one consistent view.
- Modelling: a Gold star schema with history-keeping dimensions and aggregates.
- Reconciliation: 144 checks of Gold against the sources before anything is certified.
- Security: row-level security and column masking by role.
- Consumption: a semantic layer, a Power BI report with a phone layout, a Streamlit app and Cortex Analyst for questions in plain English.
- Alerting: an email when meal wastage crosses 4%.
- Live data: a flight feed that flows from Bronze to Gold on its own.
Here is each part, in the order the data moves.
The architecture at a glance
Ten source systems feed the platform: SAP S/4HANA (finance and purchasing), SAP SuccessFactors (people), SAP Ariba (suppliers), IBM Maximo (equipment maintenance), a catering management system, airline ordering portals, SITA flight messages, contractor agency feeds, a master data hub and the airport operations database.
From there the data moves through three layers, the medallion pattern:
- Bronze: the files exactly as they arrived, plus audit columns.
- Silver: cleaned, de-duplicated and harmonised across systems.
- Gold: a star schema built for reporting, plus control tables for reconciliation and certification.
On top sit a semantic layer of certified measures and the tools people actually use: Power BI, a Streamlit app and Cortex Analyst.
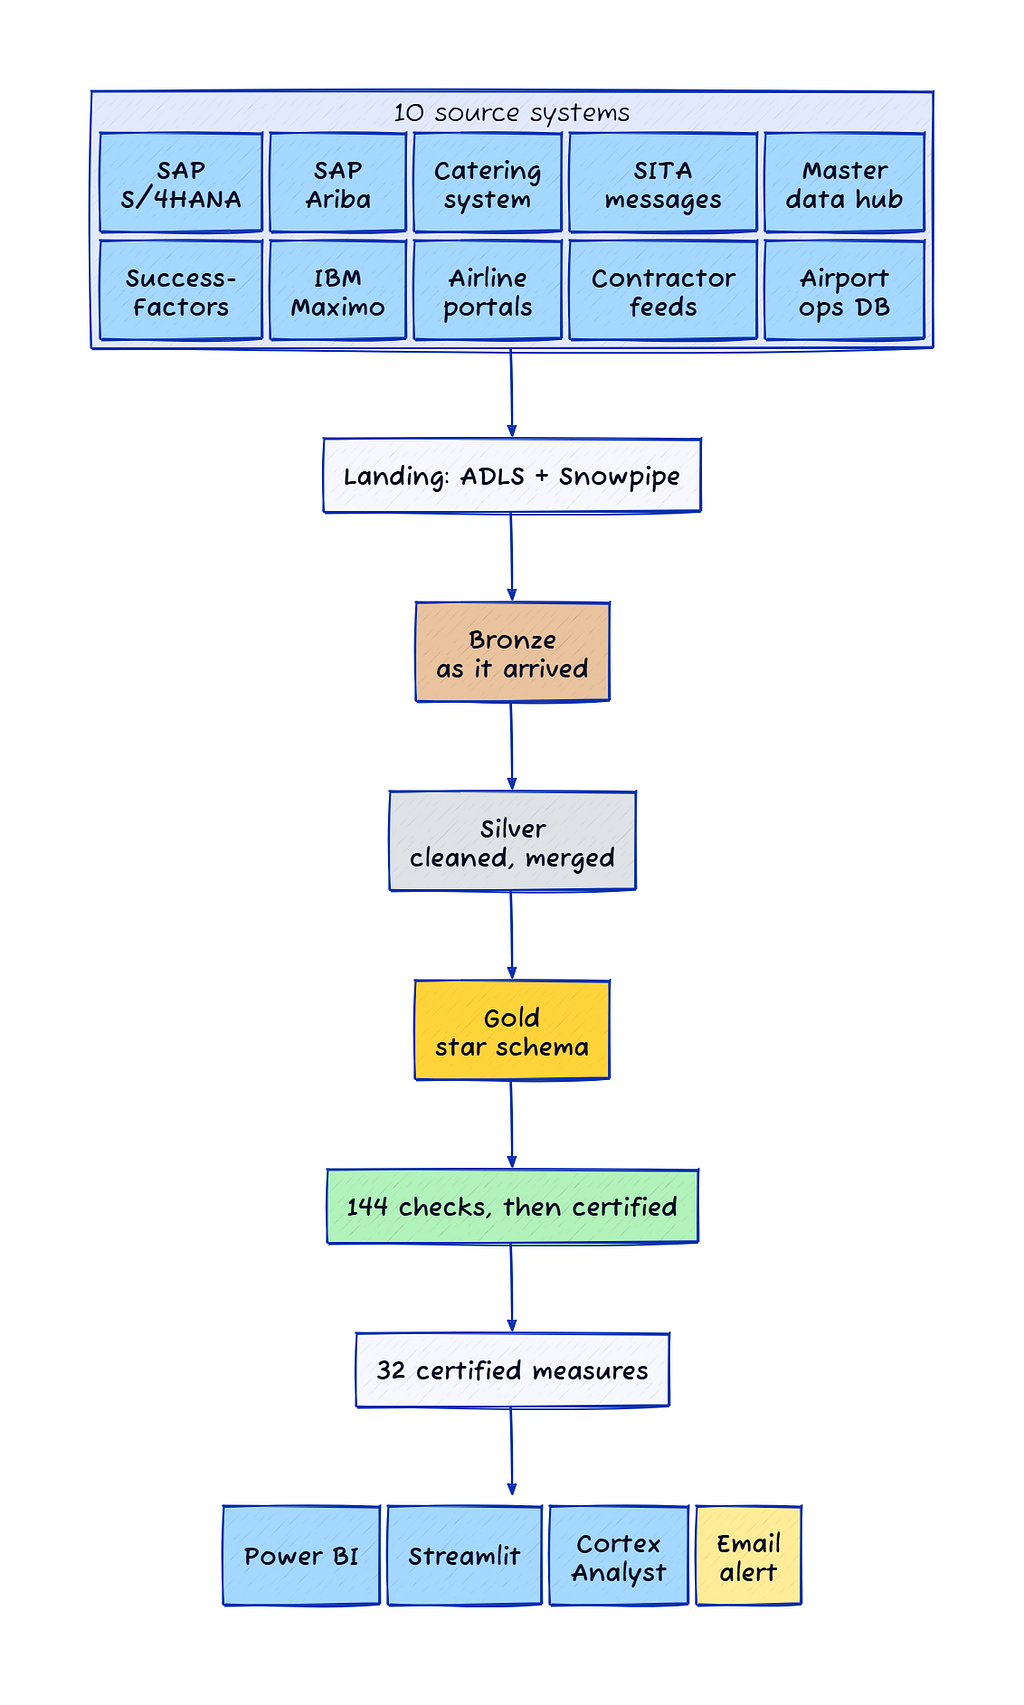
One rule holds everywhere: only Bronze is loaded from files. Silver and Gold are always built from Bronze by SQL, so any number on a dashboard can be traced back to a source extract.
Generating realistic source data
generate_data.py writes 28 Bronze extracts covering January 2025 to September 2026, plus a pair of contractor files for the quality demo. It is deterministic (seed 42), so the expected results ship with the repo in data/gold and verify_pack.py checks the generated files against the SQL definitions and those expected numbers.
Realistic data has realistic problems, so the generator plants them on purpose: duplicate records, lower-case airline codes next to upper-case ones, the same vendor created twice in two systems, and one contractor file that is broken in eight different ways. It also plants business stories worth finding, such as one airline route whose meal wastage climbs from 2.24% in June to 4.58% in September.
Landing the files
There are two ways in. The simple one uploads the files to a Snowflake stage with PUT. The realistic one lands them in an Azure Data Lake Storage Gen2 container: Snowflake reads it through a storage integration (no keys in any script), and an Event Grid notification tells Snowpipe a new file has arrived. There is one pipe per feed, 28 in all, and a file dropped into the container is in its Bronze table within about a minute.
Every load is recorded in a file load log, so you can always answer which file, which rows and when.
Bronze: the data as it arrived
Bronze has one table per source object, with column names and types that mirror the source extract. Every row carries four audit columns: the source system, the extract time, a batch id and a row hash. The initial loads are strict, so a bad file never half-loads:
COPY INTO SAP_GL_ACTUALS_MONTHLY
FROM @EDW_BRONZE.LANDING.STG_SOURCE_DROP/bronze/sap_gl_actuals_monthly.csv
FILE_FORMAT = (FORMAT_NAME = 'EDW_BRONZE.LANDING.FF_CSV_STD') ON_ERROR = 'ABORT_STATEMENT';
Bronze keeps the problems, too. The lower-case airline codes and the duplicate meal records are still there, on purpose: cleaning happens in Silver, where you can see exactly what changed.
Handling a bad file
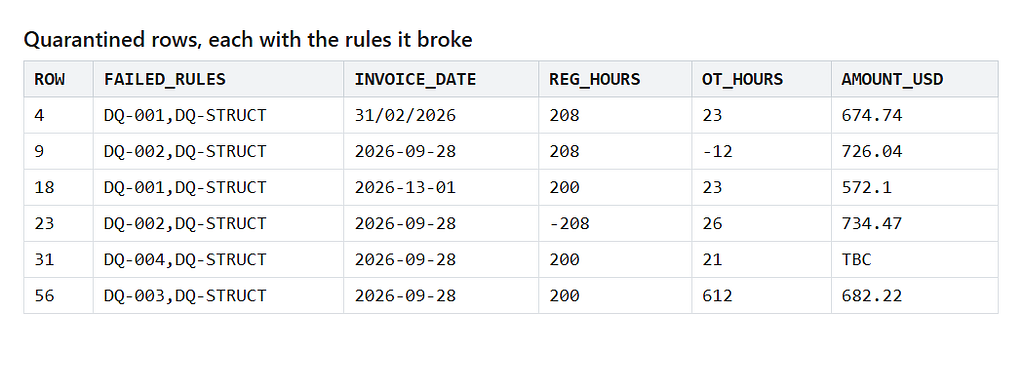
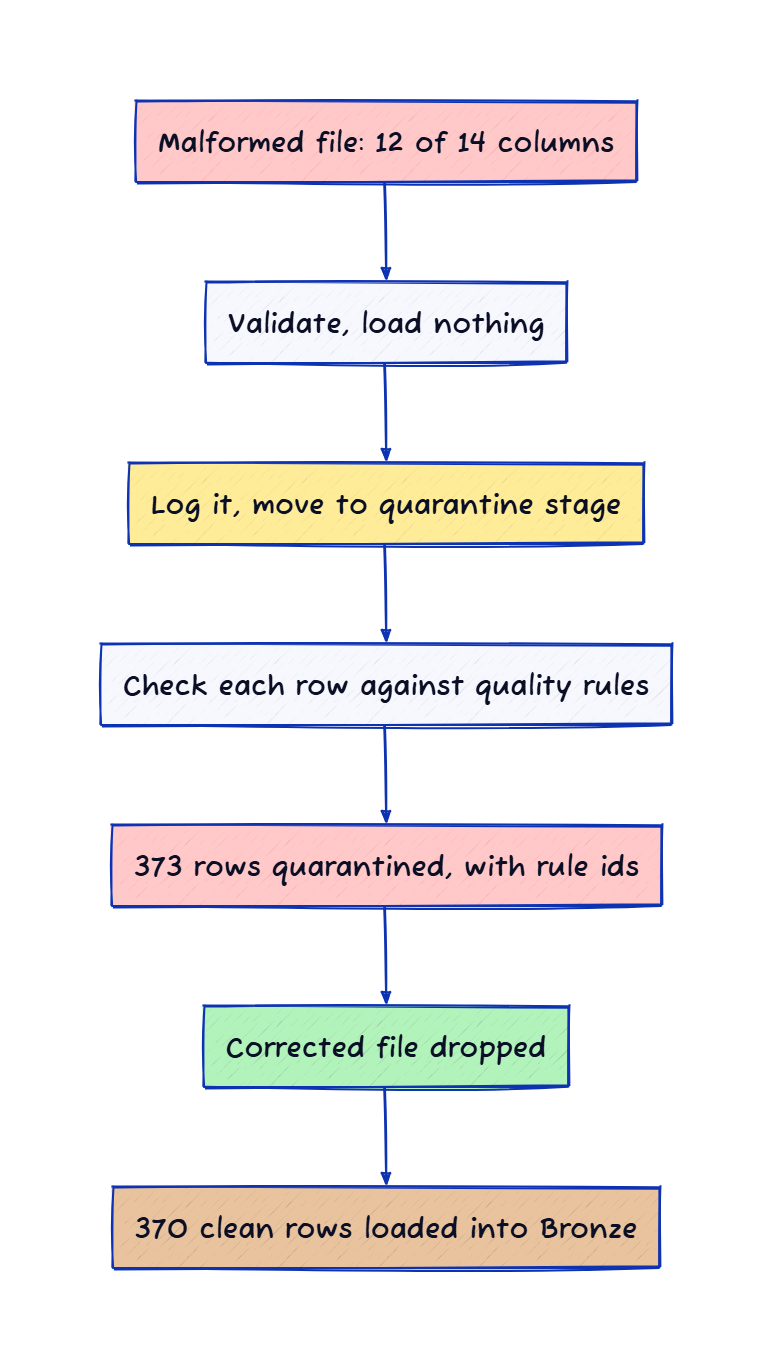
The daily contractor file shows what happens when a source sends something broken. It arrives with 12 of its 14 columns, impossible dates such as 31/02/2026, negative hours, a 612-hour month and an amount of TBC.
First the file is validated without loading anything:
COPY INTO EDW_BRONZE.LANDING.CONTRACTOR_FEED_CONTRACT
FROM @EDW_BRONZE.LANDING.STG_SOURCE_DROP/bad_files/contractor_feed_2026-09-28_malformed.csv
FILE_FORMAT = (FORMAT_NAME = 'EDW_BRONZE.LANDING.FF_CSV_STD') VALIDATION_MODE = 'RETURN_ERRORS';
It fails on the column count, so it is logged as quarantined and copied to a quarantine stage. Its rows are then landed as plain text so data-quality rules can say exactly what is wrong with each one. The rules live in a table, each with a severity and an owner:
('DQ-002', 'Hours non-negative', 'CONTRACTOR_FEED', 'REG_HOURS,OT_HOURS', 'RANGE',
 'REG_HOURS >= 0 AND OT_HOURS >= 0', 'REJECT', 0, 'HR Data Steward'),
All 373 rows of the bad file are quarantined, each tagged with the rules it broke. The corrected file is then dropped and loads 370 clean rows.
Silver: integration and cleaning
Silver is where four systems start telling the same story.
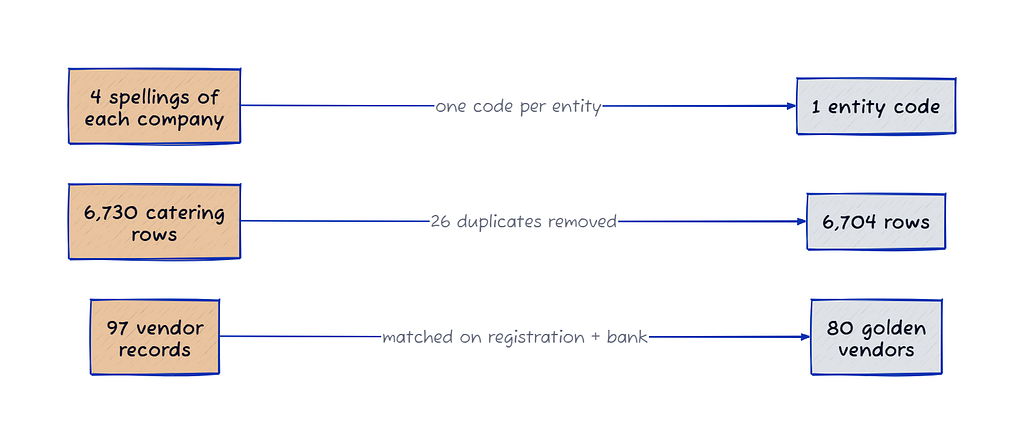
- One code per entity. SAP, SuccessFactors, the catering system and the portals each spell the legal entities differently. A mapping table turns every spelling into one code.
- Duplicates removed. The live catering feed has 26 duplicate records: 6,730 rows in Bronze become 6,704 in Silver.
- Vendor master data. The same supplier was created twice, once in SAP and once by an Ariba sync, with small differences in case, punctuation and legal suffix. Matching on the registration number and bank account resolves 97 vendor records into 80 golden vendors, with the match rule and confidence kept for each.
- Reference masters (entities, airlines, stations, cost centres, GL accounts, the flight schedule) are built from their Bronze extracts, with the latest version of each record winning.
Gold: the star schema
Gold is a star schema: fact tables for catering, finance postings, labour cost, work orders, purchase orders and airline orders, around shared dimensions for date, entity, station, airline, flight, cost centre, GL account, employee, vendor and asset.
Two parts are worth a closer look.
- History that is kept, not overwritten. The asset dimension is SCD Type 2: when a piece of equipment changes cost centre or status, the old version is closed and a new one opens. Tug T-114 has three versions: it moves to the night ramp in May 2026 and goes on a hydraulic watch list in August. Work orders point at the version that was in force on the day.
- Live data. SITA flight messages flow from Bronze to Gold on their own, through a stream and a chain of three tasks. A new message reaches the live flight board within about a minute, and each run is logged.
Reconciliation and certification
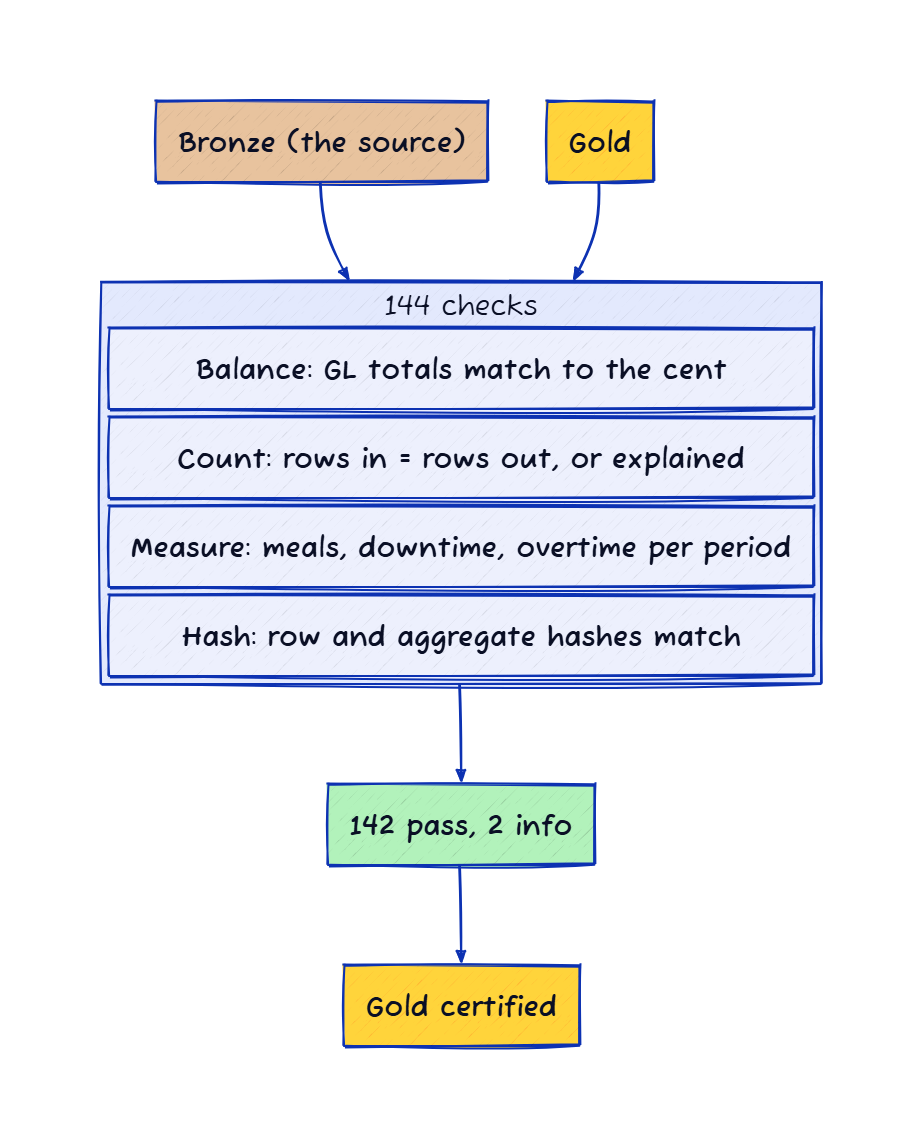
This is the part that makes the dashboards trustworthy. Before Gold is certified, a reconciliation run checks it against Bronze in four ways:
- Balance: GL totals by entity and month match the SAP extract to the cent.
- Count: rows that went in are rows that came out, or the difference is explained (for example, 26 duplicates removed).
- Measure: business totals such as meals uplifted, downtime hours and contractor overtime match per period.
- Hash: row-hash sets match between Bronze and Silver, and aggregate hashes between Silver and Gold.
The latest run has 144 checks: 142 pass and 2 are informational (the 97 to 80 vendor merge, and the 373 quarantined and 370 accepted contractor rows). Group revenue from January 2025 to September 2026 is USD 148,217,435 in both the source and Gold. Only then does the certification log stamp each fact table with its row count and a content hash.
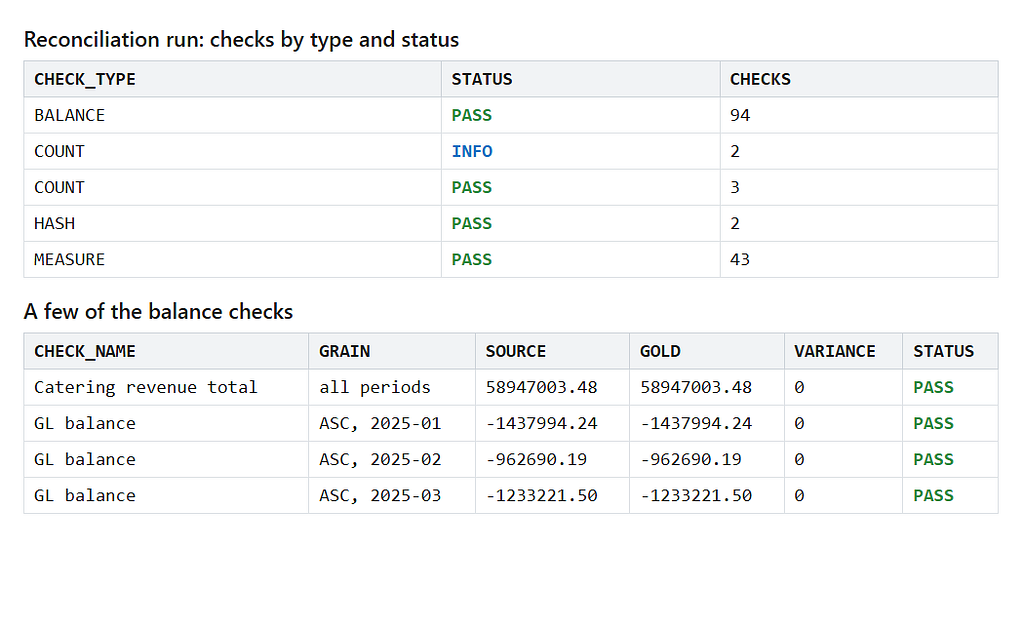
A pipeline that runs without errors is not the same as one that gives the right answer, which is the whole point of noticing a plausible wrong answer. Reconciliation is how you catch it before a dashboard does.
Security: the same query, different answers
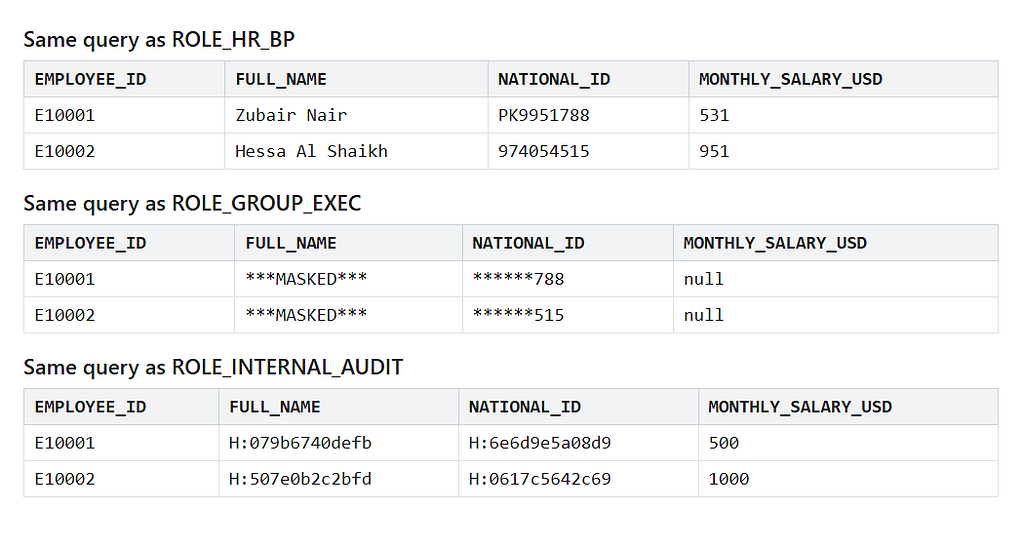
Access is defined once, in Snowflake, so it applies everywhere the data goes. There are six persona roles, such as group executive, a single entity’s finance team, an HR business partner and internal audit.
- Row access policies limit which entities, stations and airlines a role can see. A finance user for one entity runs the same query as the group executive and gets only that entity’s rows.
- Masking policies hide sensitive columns. Salaries are visible to HR, rounded to the nearest 100 for audit, and hidden for everyone else:
CREATE OR REPLACE MASKING POLICY MP_PAYROLL_AMOUNT AS (val NUMBER) RETURNS NUMBER ->
  CASE WHEN CURRENT_ROLE() IN ('ROLE_HR_BP', 'ROLE_ELT_ADMIN', 'ACCOUNTADMIN') THEN val
       WHEN CURRENT_ROLE() = 'ROLE_INTERNAL_AUDIT' THEN ROUND(val, -2)
       ELSE NULL END;
No report has to re-implement any of this. Snowflake’s own guide to row access policies covers the mechanics.
The semantic layer and the dashboards
A dashboard is only as consistent as its definitions, so the measures are defined once. A measure catalog lists 32 certified measures (cost per meal, wastage, EBITDA margin, SLA compliance and so on), each with its formula and owner, on top of semantic views over Gold. Simon Späti’s piece on the rise of the semantic layer explains why that layer matters.
Three tools read from it:
- Power BI: a report with seven pages (Executive, Catering: Unit Cost, Catering: Wastage, Airline Services, Maintenance, Human Resources and Data Governance), 79 measures, and drill-downs from quarter to month and from account manager to airline. The Executive page also has a phone layout, so it reads properly in the Power BI mobile app.
- Streamlit in Snowflake: an executive cockpit app with tabs for the same areas, running inside Snowflake, so the data never leaves it.
- Cortex Analyst: a semantic view lets people ask questions in plain English, such as “which airline contracts had the highest cost per meal last quarter, and why?”. Eight verified queries anchor the answers, and every answer comes from the same Gold views under the same security policies. More in Snowflake’s Cortex Analyst documentation.
Alerting
The last piece watches the numbers so nobody has to. A Snowflake alert checks every 15 minutes whether any airline-route’s meal wastage in the latest month is above 4% and not yet reported. If so, a stored procedure emails the new breaches and records them in an alert log, so each route is reported once a month.
In the September data, Gulfway Airways Europe crosses the line: 3.14% in August, 4.58% in September. The alert is created suspended, and it can be tested without sending anything:
CALL EDW_GOLD.CONTROL.SP_WASTAGE_ALERT(FALSE); -- shows the email it would send
Run it yourself
- Replace three placeholders: your Snowflake account in Power BI, your Azure tenant if you use the Data Lake landing, and an alert email address verified on a Snowflake user.
- Run sql/01_snowflake_setup.sql as ACCOUNTADMIN.
- Upload the files to the stage, or use the Azure scripts in azure/.
- Run the SQL files in order. The README lists the exact sequence.
- Open the Power BI project and refresh.
From an empty account to certified Gold took 193 seconds on a Medium warehouse.
What it doesn’t cover
- Scheduling. Snowpipe loads new files into Bronze on its own, but Silver and Gold are rebuilt by running the scripts. Only the live flight feed runs on tasks.
- The alert looks at the latest month only. If a new month lands before the alert has run, the previous month’s breach is never emailed.
- The data is synthetic. Volumes and prices are plausible but invented, and some history is thinned to keep the repo small.
If you are weighing Snowflake against Databricks for a build like this, I compared the two by building the same pipeline on both.
The full code, the generated data and a step-by-step walkthrough are in the repo.
Muhammad Mairaj is a Senior Backend Engineer with 8 years building payment and data systems. He writes about data engineering, measured. More about him.