// essays · 21 November 2026 · 4 min read
Explaining a data platform decision to people who don’t write SQL
The numbers were right. The unit was wrong, and an analogy did more work than any chart.
 Muhammad MairajSenior Backend Engineer

The hardest part of moving analytics data to a lake wasn’t the engine tuning. It was explaining the result to people who have to approve it and have never written a query. My first written summary got the most important number wrong in a way that only showed up when I read it as they would. Here’s what I’d do differently from the first sentence.
Report the number they will feel
My first summary said the new setup was “about half a second slower” on small questions. That was true. It was true per query.
Then I ran a full end-to-end test, where whole answers took several seconds longer, and put it next to my summary. Anyone reading both would ask the obvious thing: you said half a second, so why is it more? Both were true. The agent runs several queries per answer, and every one of them crossed the internet from where the app ran. Half a second per query had quietly become seconds per answer.
Nobody waits for a query. They wait for an answer. So I rewrote the report around full answers. Once the app ran next to the lake, answers took the same time as on the old database, and most of that time was the AI thinking anyway. Same data, a unit people can feel, and the decision got easier, not harder.
If you only change one habit, change this one. Find the thing the person actually waits for, and measure that.
Give each finding a picture
Engineers like to name things: REST catalog, metadata lookup, precomputed table. Each name is a small wall. What worked better was one everyday picture per idea, stated before any number.
The slow lookups became a delivery driver who phones head office for the address of every stop, every day, even though the addresses never change. The fix, a local copy of where each table lives, became “give the driver a notebook”. Nobody asked what a catalog was after that.
Precomputing became cooking. A restaurant chops the vegetables and makes the sauce in the morning, so an order takes minutes instead of an hour. That one sentence carried “ready tables rebuilt after each data refresh” and its real cost: someone has to do the morning prep, every morning, or the food is stale.
The lake versus the extra database became a warehouse and a shop counter. The warehouse holds everything, cheaply. The counter holds a few ready items for quick service, and if you clear the counter you restock it from the warehouse. That answered a fair objection, “why move to a lake if we end up with a database again?”, in two lines.
The two systems became two kitchens. One cook works in their own kitchen with the ingredients on the shelf and remembers every recipe they’ve made. The other works in a rented kitchen across town from the warehouse and re-reads the recipe every time. That’s the honest reason one was faster out of the box, and why the fixes were about distance and memory, not effort.
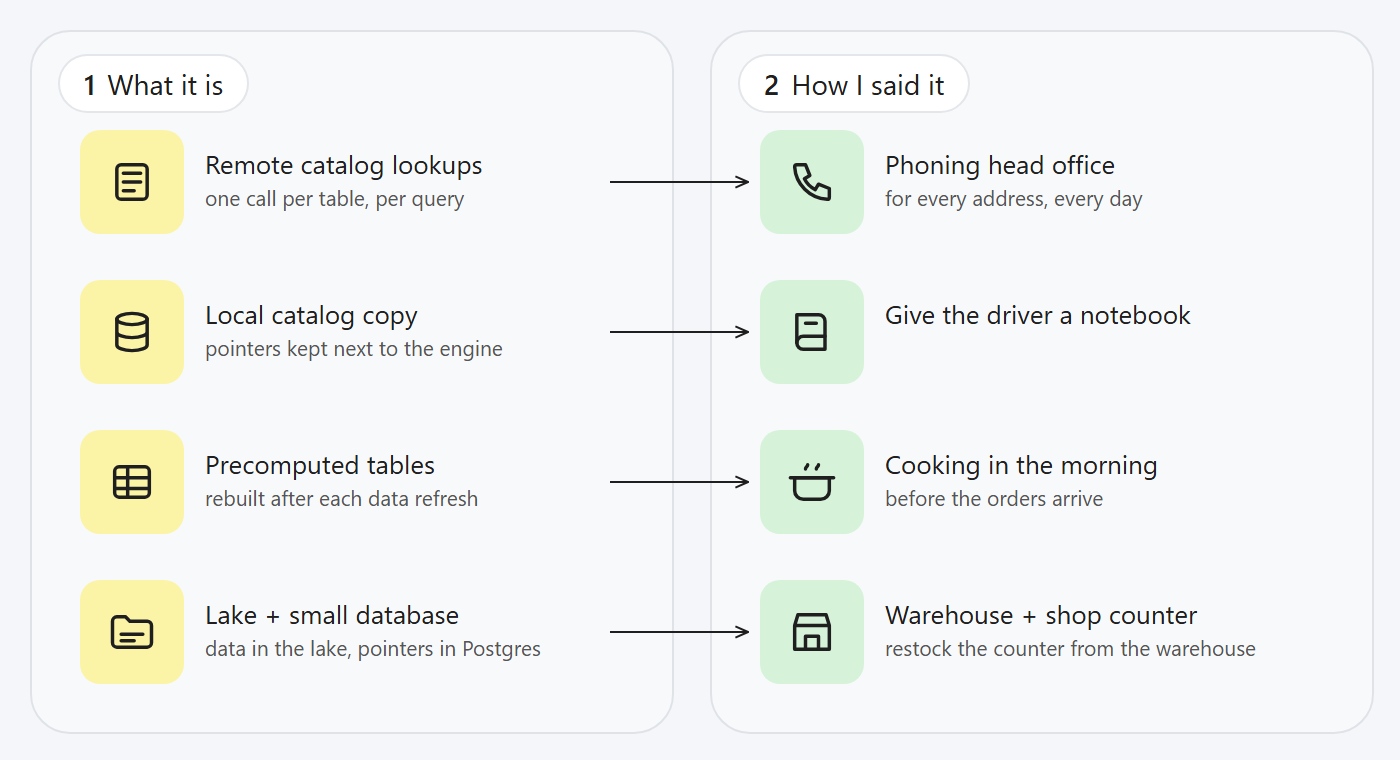
One picture per idea, said before any number.
Shrink until it survives “I did not understand”
My first explanation of the trade-offs was a careful list of five caveats. Read cold, as someone outside engineering would read it, it didn’t land.
The second version was three short sections: what we gain, what we give up, the one thing it costs us. Still too much. The version that landed had one sentence per point and a single line at the end: speed is fine, the real price is building and running the update job.
It felt like I was throwing away nuance. I wasn’t. The nuance moved to the detailed report, and the summary did its one job, which is letting someone decide.
Answer the question that was asked
The questions a decision-maker asks are often yes-or-no in disguise. “Is this with precomputed tables?” “Is the server in the right region?” “Can we just move it?” The useful answer starts with “Yes” or “No” and then gives one sentence of why. Starting with context makes the reader dig for the answer, and makes it look like you’re hedging.
The same goes for corrections. My draft said the move was “about growth, not speed”. That was wrong: we wanted both, and a decision-maker would rightly reject a plan that shrugs at speed. The fix was to change the sentence and say so plainly, not to defend the original wording. The report now says it in its first section.
Put the costs where they’ll see them
Business readers are rightly suspicious of a page that’s all upside. Mine ended with a short list of what the design costs: a job to build and look after, a little compute per rebuild, and a placement rule (the app and the data in the same region). Then the decisions needed, numbered, each one a sentence.
I learned the shape of this years ago working with legal on payment compliance, where every technical control had to be explained to people who would sign off on it, and where “it’s complicated” was not an answer anyone accepted. The engineering can be complicated. The decision page can’t be.
The checklist I use now
Report what people wait for, not what the system measures. Say where the test ran. Give each idea one everyday picture before its number. Answer yes or no first. Put the costs on the same page as the gains. Shrink until someone outside your field can repeat it back.
The data was never the hard part. The sentence was.
Muhammad Mairaj is a Senior Backend Engineer with 8 years building payment and data systems. He writes about data engineering, measured. More about him.